Chapter 7 · complete English translation
Discussion
S. 165–188 – Discussion, Conclusions, Recommendations and Closing
7.3 AI system and comparison with similar studies
The AI system achieved overall accuracy and weighted F-score values of 94.3%–94.5% in the training group, 93.9%–94.1% in the validation group, and 91.2%–92.2% in the test group (Table 57). This represents high accuracy and is consistent with the international studies presented previously. The slightly lower values in the present study can be explained by the different study design and the type of sample compiled.
Based on the weighted F1-score, the network for the anterior elevation map achieved the highest accuracy in the test group, followed by the posterior elevation map, the anterior refractive power map, and the equivalent refractive power map. This partially agrees with earlier studies. In Kuo et al. (2020), the posterior elevation map achieved the best result, followed by the posterior curvature map, the anterior elevation map, and the pachymetry map. In Abdelmotaal et al. (2020), the posterior elevation map was best, followed by the anterior sagittal curvature map, the anterior elevation map, and finally the pachymetry map (cf. Table 5).
Table 57 – Summary of neural network and AI system results.
| Map/Model | Accuracy Training | Accuracy Validation | Accuracy Test | Weighted F1 Training | Weighted F1 Validation | Weighted F1 Test |
|---|---|---|---|---|---|---|
| Overall | 0.945 | 0.941 | 0.922 | 0.943 | 0.939 | 0.912 |
| RAP | 0.907 | 0.858 | 0.896 | 0.890 | 0.846 | 0.852 |
| RPP | 0.889 | 0.907 | 0.896 | nan | nan | nan |
| TA | 0.871 | 0.876 | 0.896 | nan | nan | nan |
| TP | 0.898 | 0.897 | 0.896 | 0.863 | 0.865 | nan |
| TEAE | 0.890 | 0.912 | 0.893 | 0.860 | 0.883 | 0.864 |
| REF | 0.884 | 0.902 | 0.891 | 0.852 | 0.866 | 0.850 |
| SP | 0.896 | 0.907 | 0.891 | nan | nan | nan |
| TEPE | 0.902 | 0.904 | 0.877 | 0.875 | 0.882 | 0.853 |
| THK | 0.837 | 0.837 | 0.860 | 0.811 | 0.809 | nan |
| SA | 0.888 | 0.904 | 0.841 | 0.850 | nan | nan |
7.4 Comparison with other models
- The AI system, the SIRIUS device, and the physician without support achieved similar results, with a slight advantage for the physician, followed by the AI system. No statistically significant difference existed between them.
- The physician with SIRIUS device support achieved better results than the AI system, the SIRIUS device, and the physician without support. The difference compared with SIRIUS and the physician without support was statistically significant; compared with the AI system it was not significant.
- The physician with AI system support achieved the best result compared with all other models. The difference was statistically significant compared with all other models including the physician with SIRIUS support (Tables 53 and 58).
Table 58 – Summary of all model results.
| Model | Accuracy | Weighted F1-score |
|---|---|---|
| DR&AI | 0.962 | 0.959 |
| DR&CSO | 0.945 | 0.941 |
| DR | 0.929 | 0.924 |
| AI | 0.922 | 0.912 |
| CSO | 0.919 | 0.911 |
7.5 Discriminative feature maps and heatmaps
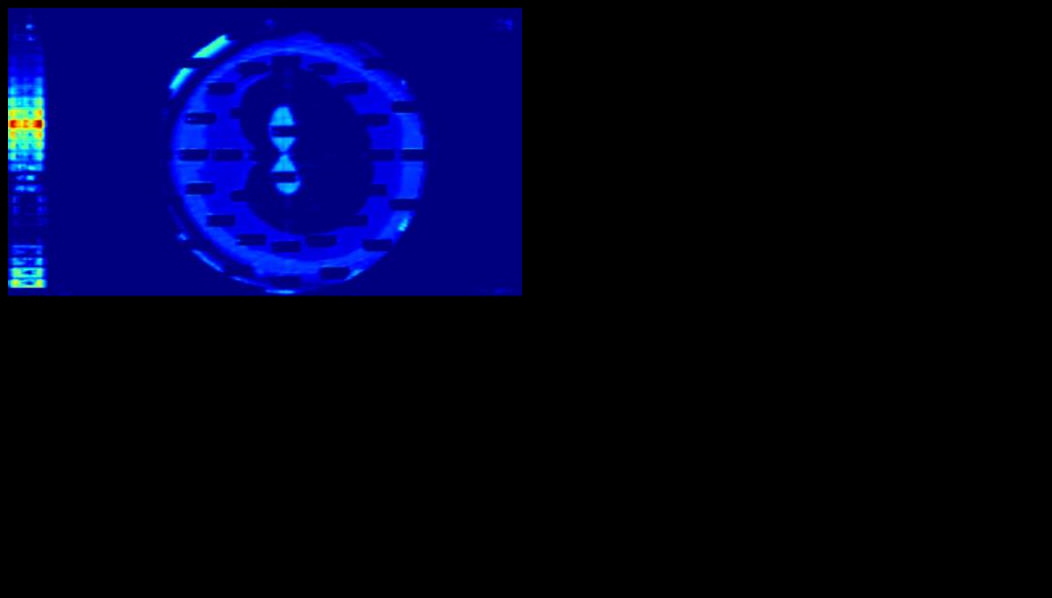
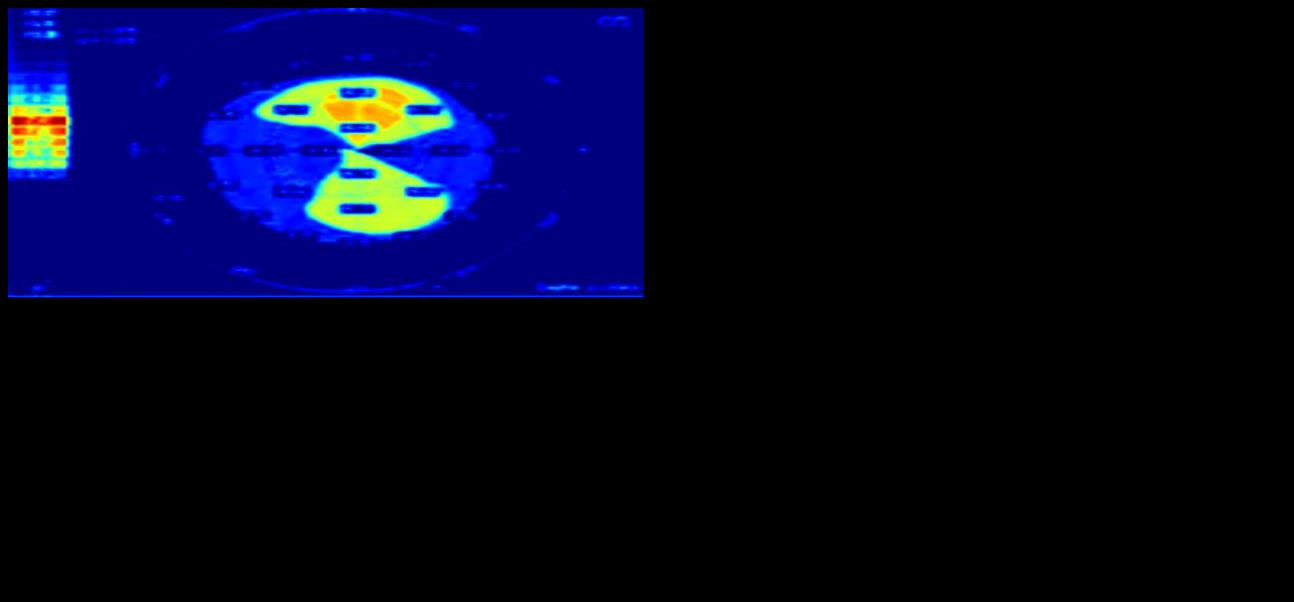
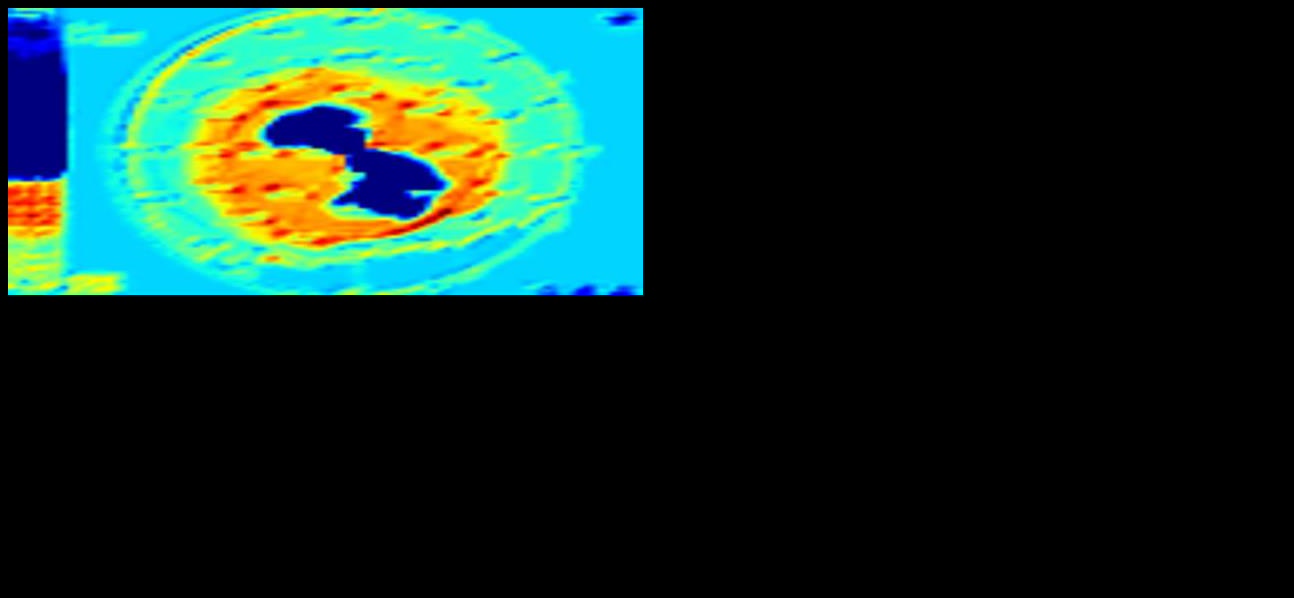
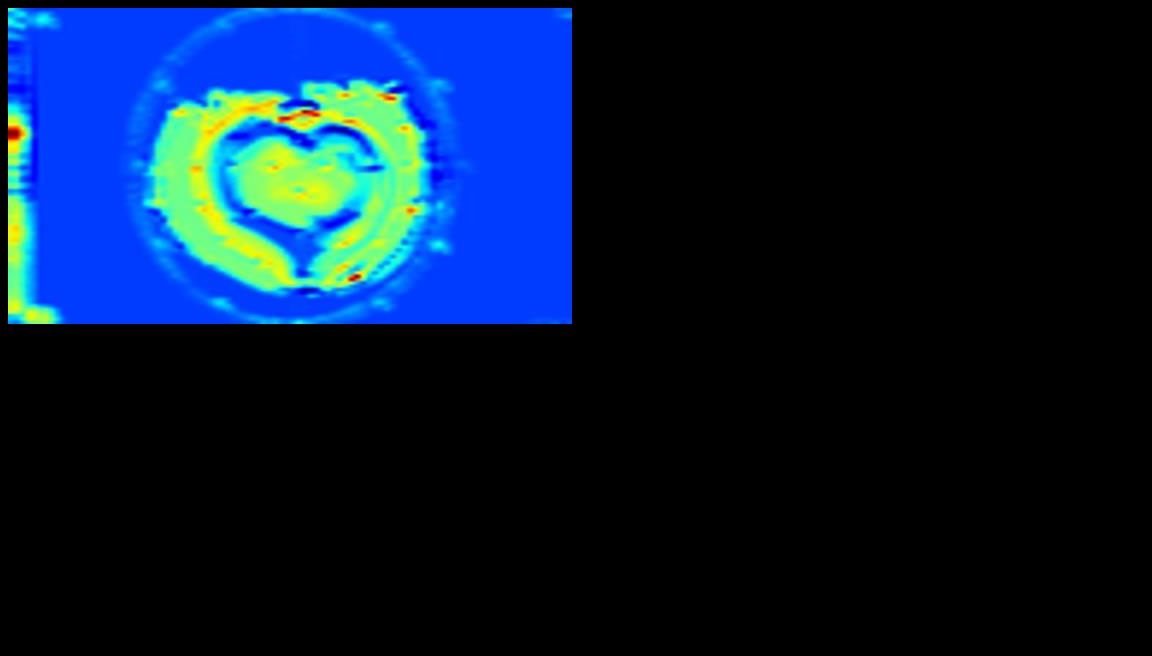
As mentioned earlier, a limitation of neural networks is that it is not precisely known what happens during the decision-making process. The network learns from examples, and it is difficult to recognise which patterns it has learned. Discriminative feature maps and heatmaps help to understand the processes within the model and the patterns used for the decision. Below, examples of the heatmaps for each trained neural network are described. The networks were trained with images of normal and keratoconic corneas. The heatmap was placed on the right and overlaid with the topography map image on the left; this makes the patterns used by the network for decision-making visible.
7.5.1 Anterior sagittal curvature map
The neural network could obviously distinguish the symmetrical butterfly pattern of the normal cornea from the inferior curvatures of the keratoconic cornea (Figure 95).
7.5.2 Posterior sagittal curvature map
The network could obviously distinguish the symmetrical butterfly pattern of the normal cornea from the irregular shape of the keratoconic cornea (Figure 96).
7.5.3 Anterior tangential curvature map
The network could obviously distinguish the symmetrical butterfly pattern of the normal cornea from a butterfly pattern with inferior curvature in the keratoconic cornea (Figure 97).
7.5.4 Posterior tangential curvature map
The network could obviously distinguish the symmetrical pattern of the normal cornea from the curved bulges of the keratoconic cornea (Figure 98).
7.5.5 Anterior elevation map
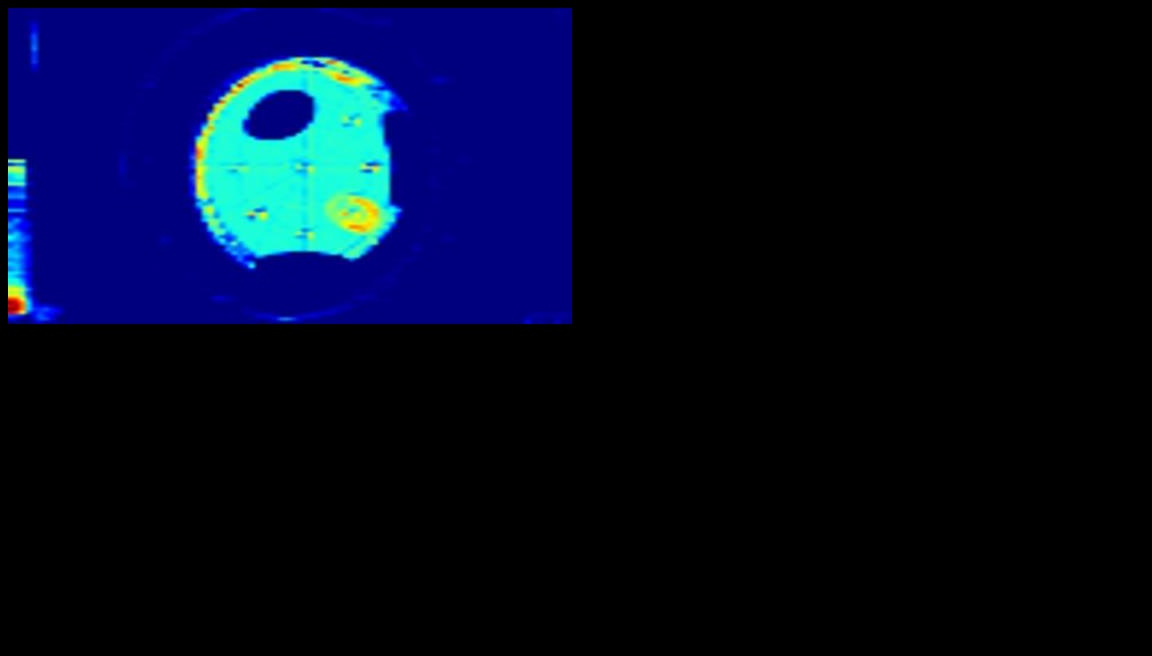
The network could distinguish the elevations and assess their significance. In the normal cornea, it ignored the elevation and did not interpret it as indicative of keratoconus. In the keratoconic cornea, it could recognise the elevation and the opposing depression, as if it had identified an aberration of the separating surface (Figure 99).
7.5.6 Posterior elevation map
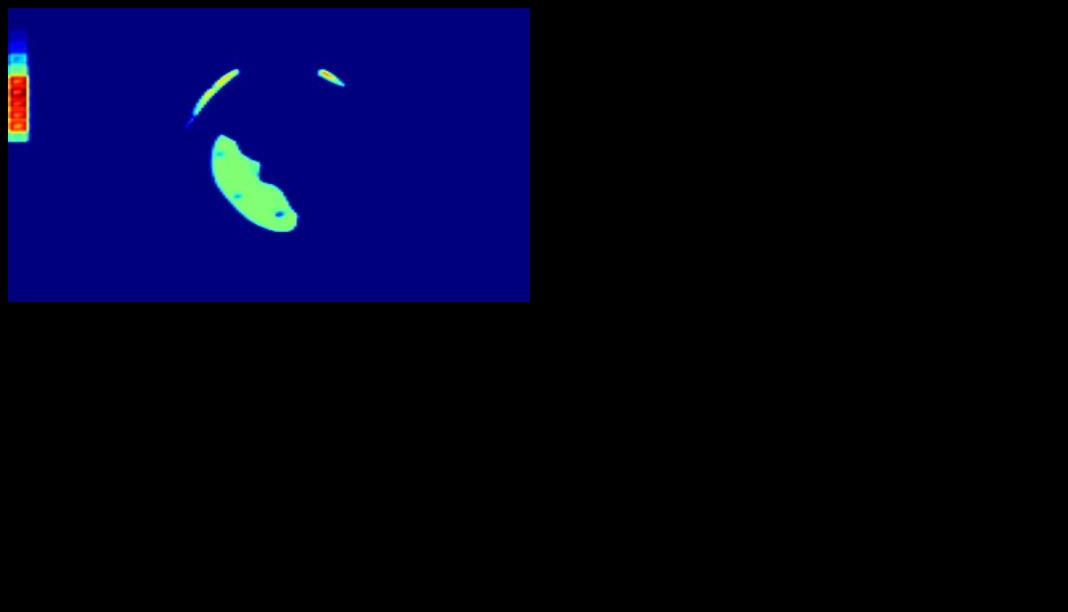
The network distinguished the elevations and the tongue-like structure in the image of the keratoconic cornea (Figure 100).
7.5.7 Pachymetry map
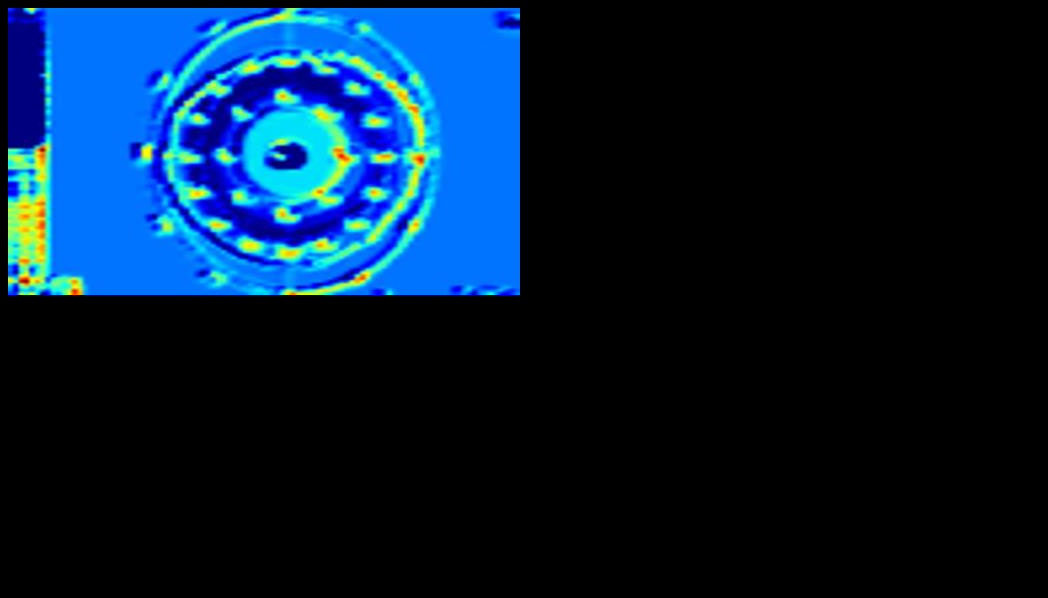
The network could distinguish the thinning area and the inferior displacement of the thinnest point in the image of the keratoconic cornea (Figure 101).
7.5.8 Equivalent refractive power map
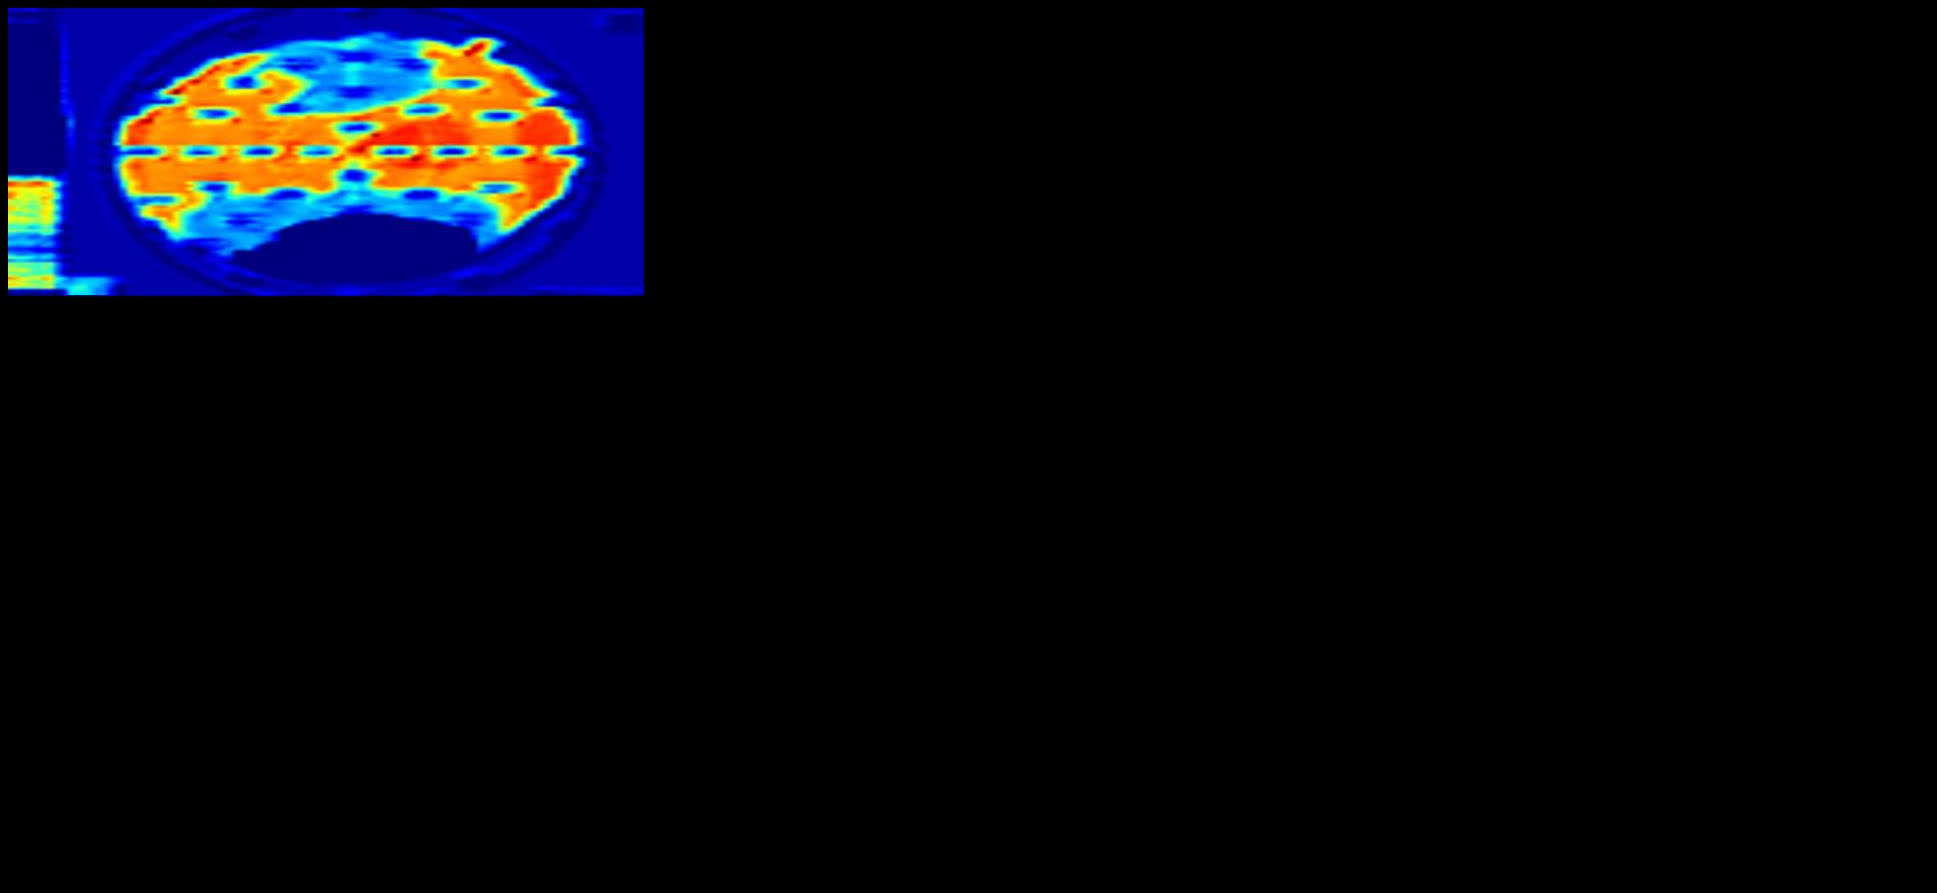
The network obviously distinguished the symmetrical pattern in the normal cornea image from the markedly asymmetrical pattern in the keratoconic cornea image, focusing on the areas with lower curvature (Figure 102).
7.5.9 Anterior refractive power map
The network obviously distinguished the symmetrical pattern in the normal cornea image from the asymmetrical pattern in the keratoconic cornea image, again focusing on the areas with lower curvature (Figure 103).
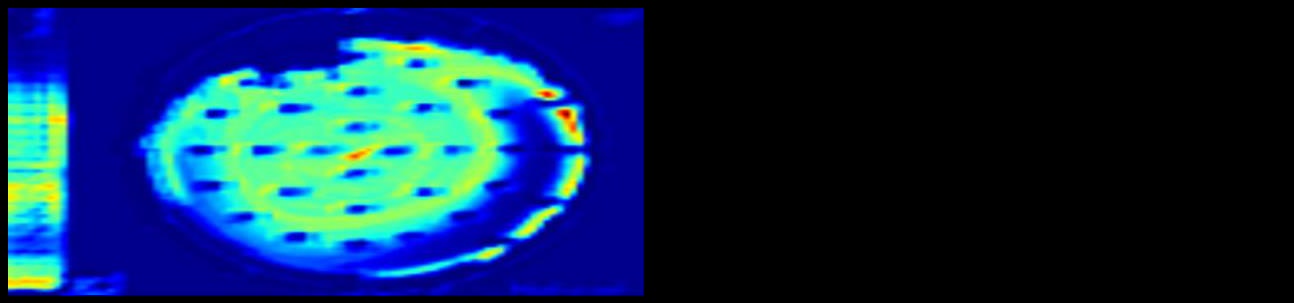
7.5.10 Posterior refractive power map
The network obviously distinguished the symmetrical pattern in the normal cornea image from the inferior curvature in the keratoconic cornea image, focusing on the areas with higher curvature (Figure 104).
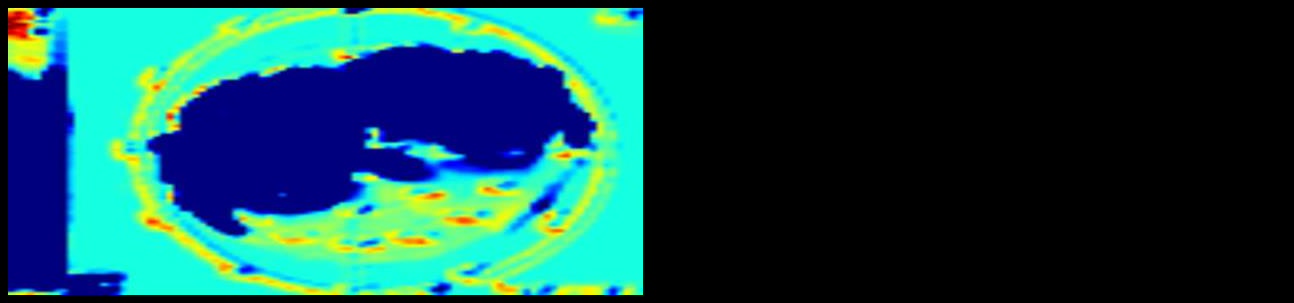
7.6 Examination of some cases
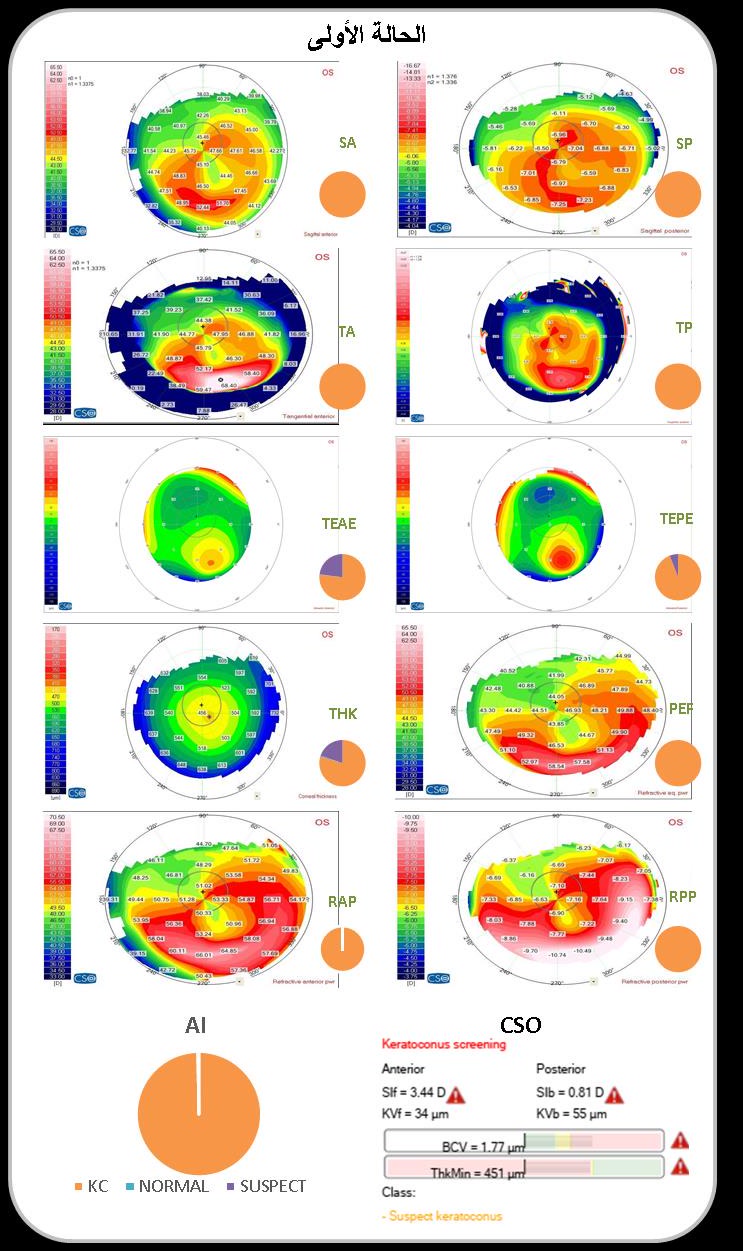
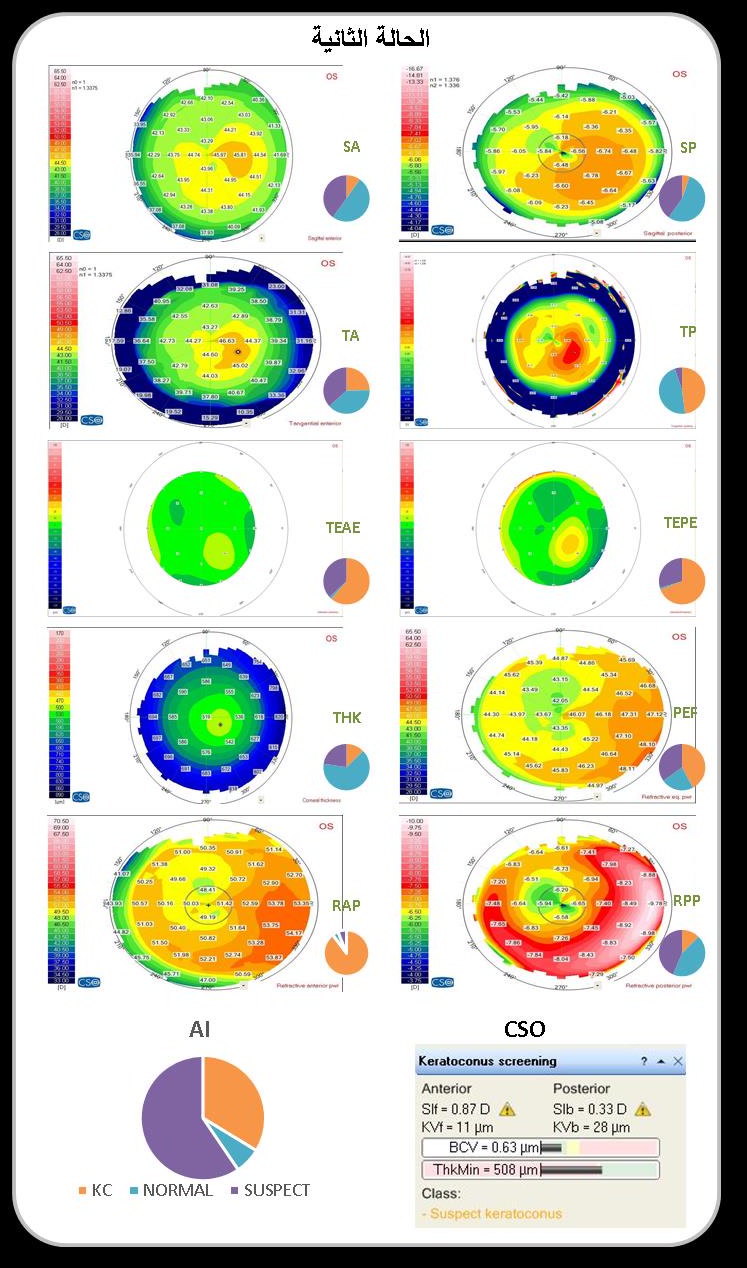
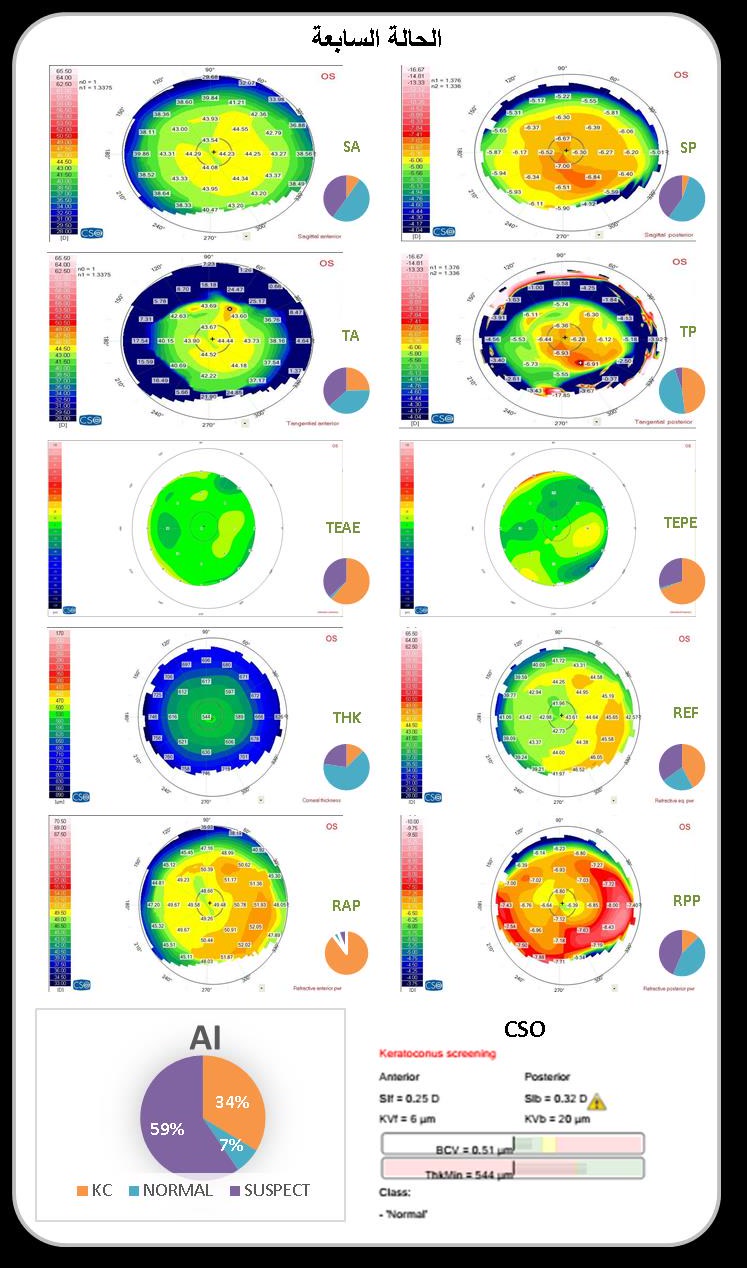
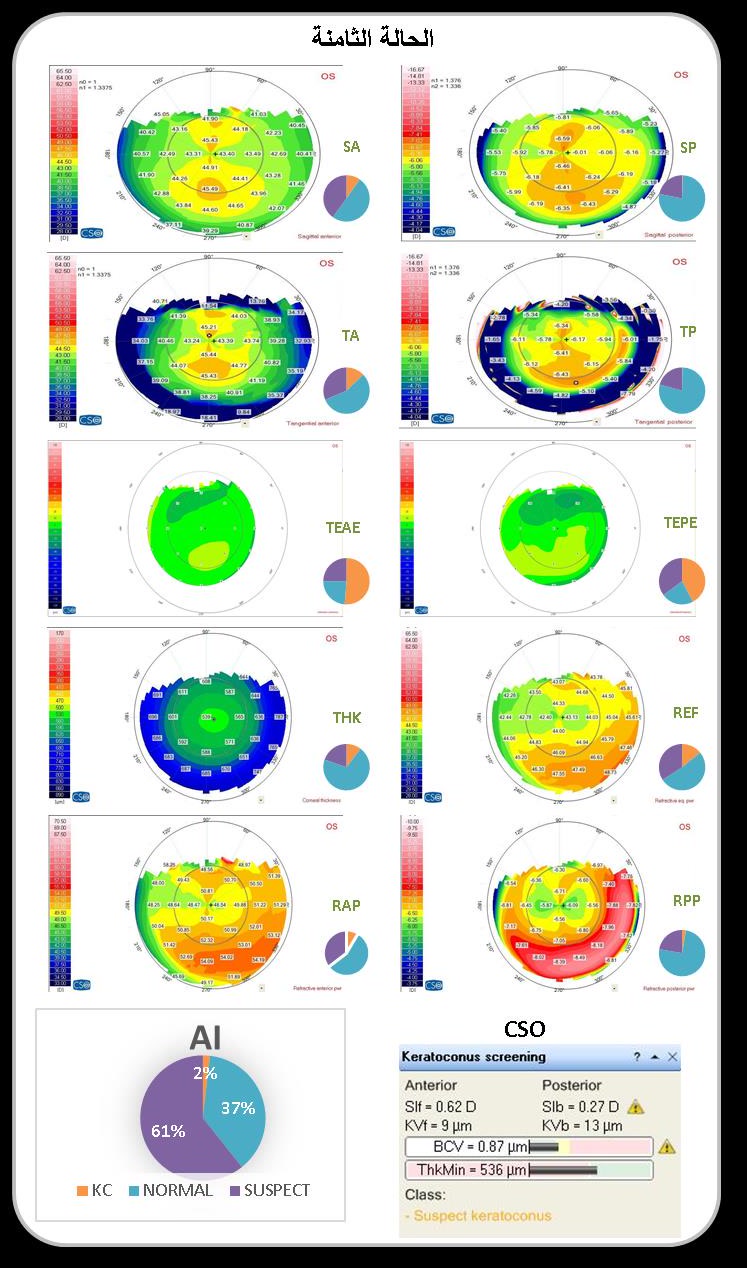
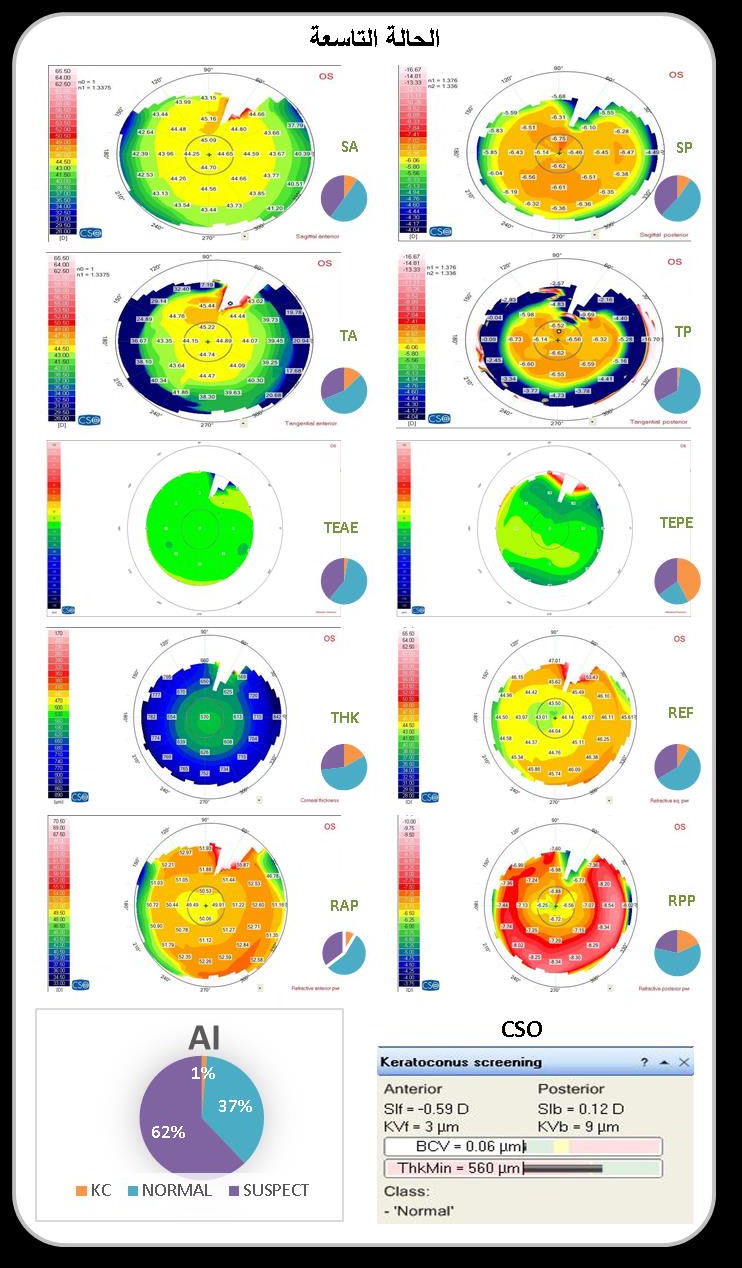
Here, some cases and the results of the various models are compared with each other. For this purpose, the accompanying figure with the map images and a chart showing the probability of each class by the respective responsible neural network is used. Finally, the final result of the AI system is compared with the result of the SIRIUS device software.
7.6.1 Case 1
A keratoconic case was diagnosed by both the AI system and the physician; the SIRIUS device software classified it as a suspect case despite clear signs of keratoconus (Figure 105). This case demonstrates one of the limitations of the SIRIUS device software.
7.6.2 Case 2
This was a borderline keratoconic case. The changes on the anterior sagittal curvature map were not characteristic and most closely resembled the vertical D-form (Figure 106). Neither the AI system nor the SIRIUS device software nor the physician could diagnose it; it was classified as a suspect case. When comparing the probability of keratoconus, the tangential curvature networks detected changes better than the sagittal ones. This agrees with Tummanapalli, Potluri, Vaddavalli and Sangwan (2015), who found that tangential maps detect subclinical cases better. The case demonstrates the importance of tangential maps and of history-taking and clinical examination: the scissoring reflex was present, and the other eye showed definite keratoconus.
7.6.3 Case 3
A definite keratoconic case was correctly diagnosed by the AI system, while the physician and SIRIUS software classified it as a suspect case. Physician assessment with AI system support was correct (Figure 107). The cause of the error may have been physician fatigue or lack of attention due to workload. This underscores the importance of assessment with AI system support and simultaneously demonstrates a limitation of the SIRIUS device software.
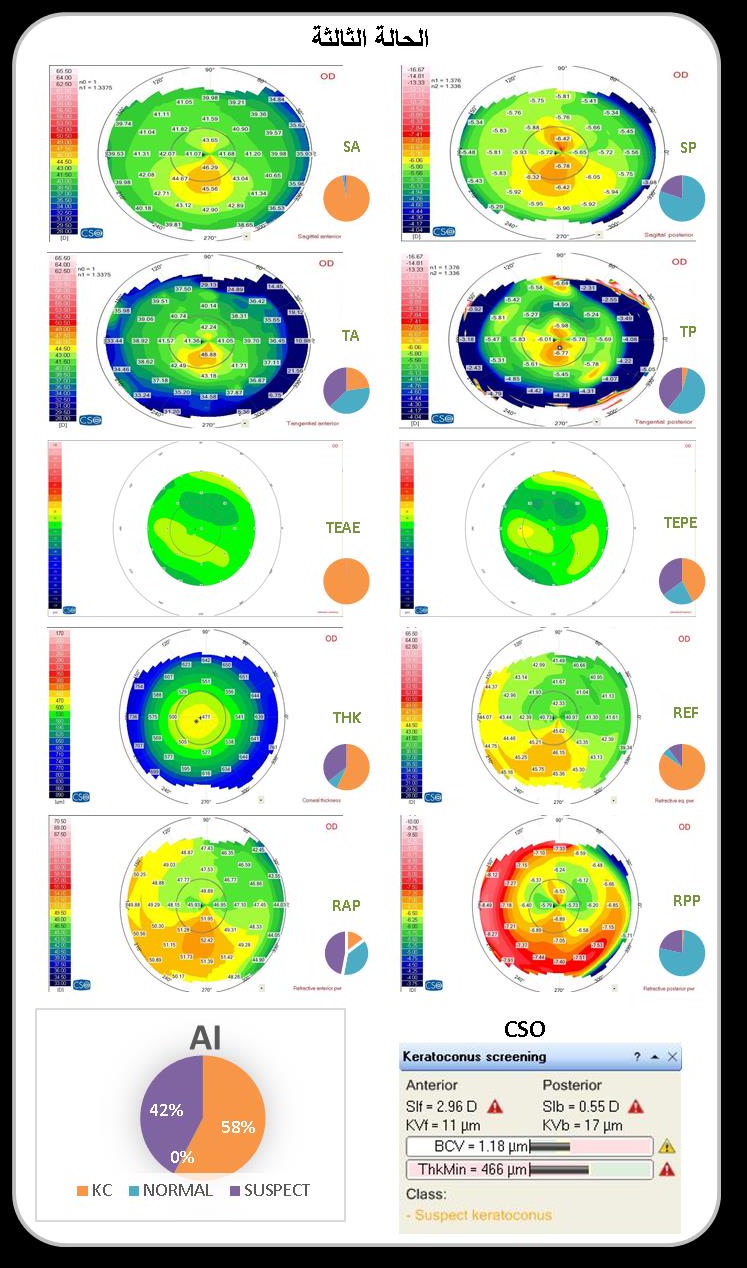
7.6.4 Case 4
A suspect keratoconus case (forme fruste keratoconus) was diagnosed as definite keratoconus by the AI system and the physician. The SIRIUS device software classified it as a suspect case. The maps showed an elevation on the posterior elevation map, however outside the 5-mm circle. All charts except the elevation maps indicated definite keratoconus; the elevation maps indicated suspicion (Figure 108). Although the case was borderline, it illustrates the importance of reviewing the topographic diagnostic criteria, particularly the posterior curvature maps, which can supplement the posterior elevation map in the diagnosis.
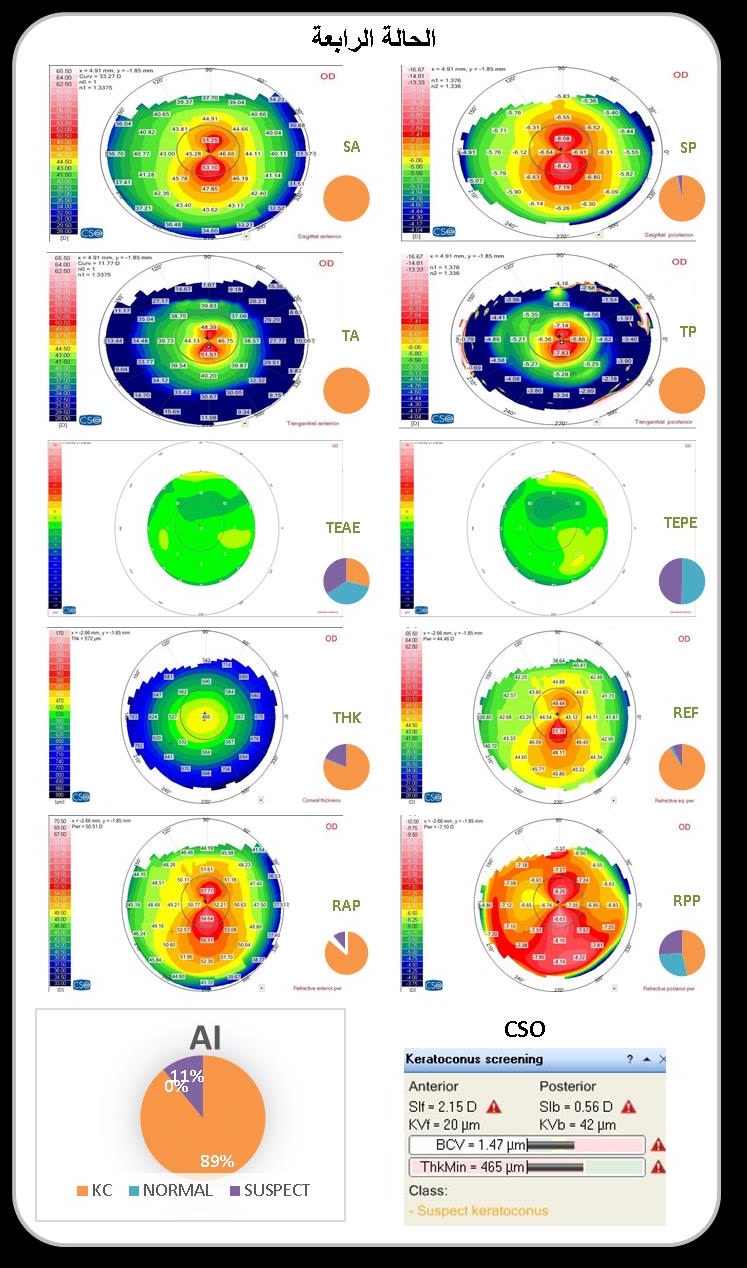
7.6.5 Case 5
A suspect case was diagnosed as definite keratoconus by the AI system and the SIRIUS software, while the physician assessed it as a suspect case (Figure 109). The charts show that the elevation maps first indicate definite and then suspect keratoconus, without clear elevations. However, upon closer inspection, an irregular depression is found within the 5-mm circle, indicating irregularities and aberrations. This borderline case also underscores the importance of reviewing the topographic keratoconus criteria, particularly the aberrations.
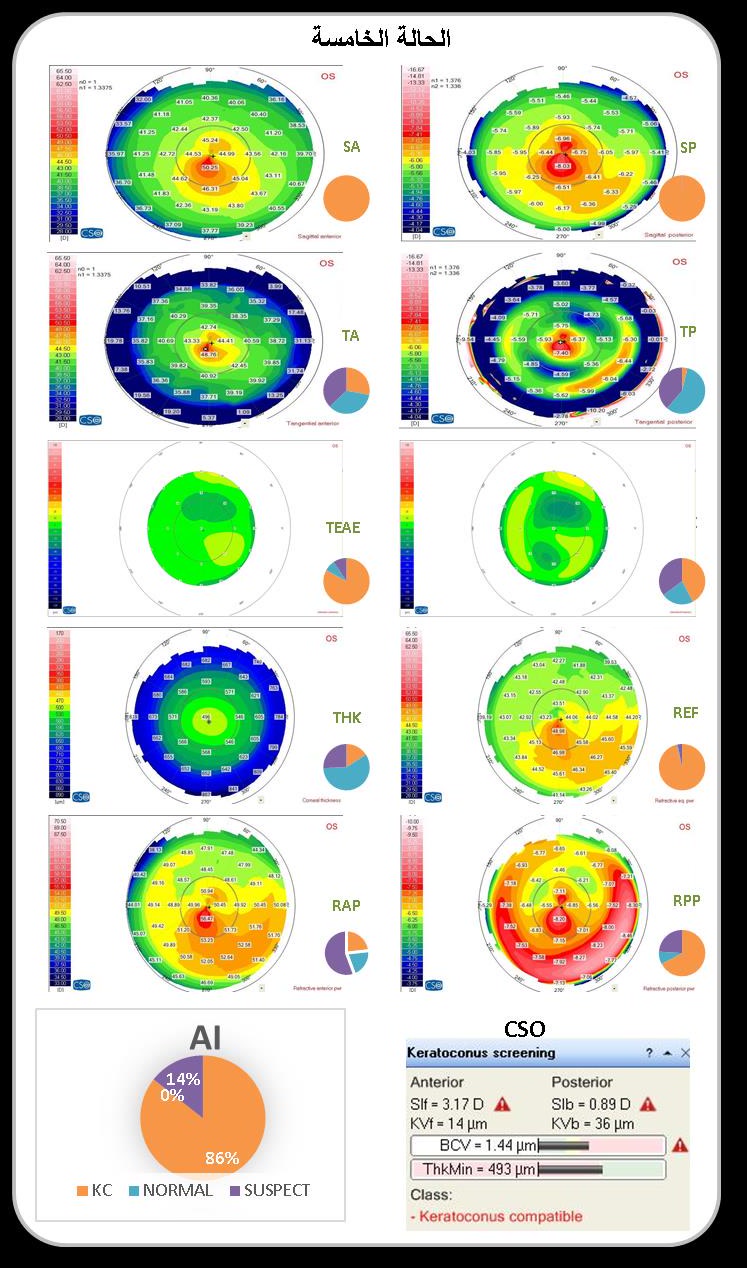
7.6.6 Case 6
A suspect case was assessed as normal by the AI system and the physician, but correctly identified by the SIRIUS software and the physician with support (Figure 110). The posterior elevation map contains a clear elevation; the associated chart indicates keratoconus. However, the final result of the AI system gave a probability of 53% for normal and 46% for suspect. This underscores the importance of assessment with AI system support.
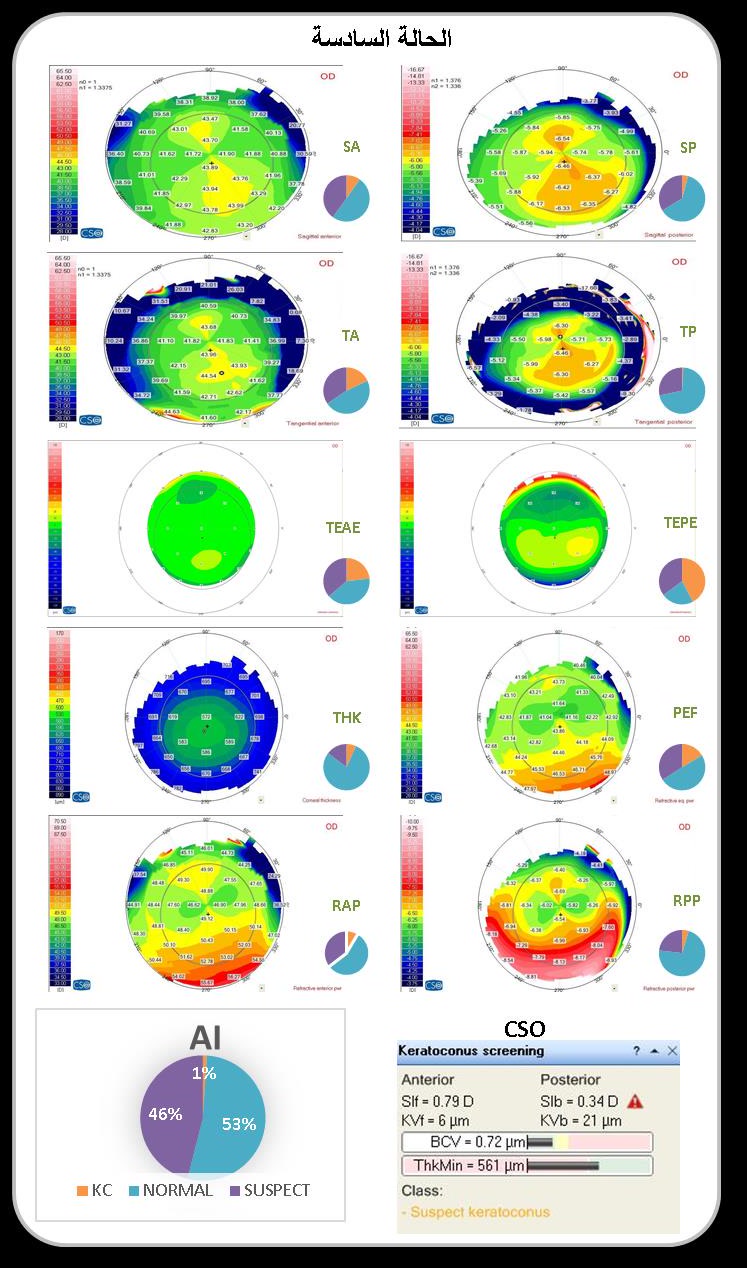
7.6.7 Case 7
A suspect case was assessed as normal by the SIRIUS software and the physician, but correctly identified by the AI system and physician assessment with AI support. The posterior elevation map contains a clear elevation and the associated chart indicates keratoconus; the charts of most other maps also indicate definite or suspect keratoconus (Figure 111). This underscores the importance of assessment with AI support and shows that SIRIUS did not detect the case despite a clear posterior elevation.
7.6.8 Case 8
A normal case was assessed as a suspect case by the AI system, the SIRIUS software, and the physician. The elevation maps indicated definite or suspect keratoconus without the aforementioned topographic signs (Figure 112). However, upon closer inspection, opposing elevations and depressions are found within the 5-mm circle; this indicates irregularities and aberrations and could explain the diagnosis.
7.6.9 Case 9
A normal case was assessed as a suspect case by the AI system, while the SIRIUS software and the physician correctly classified it as normal. The posterior elevation map indicated definite or suspect keratoconus without the aforementioned topographic signs (Figure 113). However, upon closer inspection, opposing elevations and depressions are again found within the 5-mm circle, indicating irregularities and aberrations that could explain the diagnosis.
7.7 Strengths and weaknesses of our study
Strengths:
- The only study that included ten different maps of topographic images.
- Use of a novel network model proposed by us, as well as transfer learning and data augmentation during training.
- Training with real images.
- Relatively large training sample.
- Three classes in training and testing: normal, keratoconic, and suspect corneas.
- Independent test group, separate from training and validation groups.
- Use of the SIRIUS device, which combines Placido disc and Pentacam camera.
- Examination of heatmaps to understand network function.
- Examination of physician map assessment with support from the proposed AI system.
Weaknesses:
- Training, validation, and test groups were imbalanced. This affects training and accuracy metrics. Therefore, a class-weighted loss was used during training; the metrics were calculated according to prevalence proportions, including PPV and NPV. Additionally, the F1-score was examined, as it is more suitable than the pure accuracy metric in such situations.
- Although SIRIUS is a modern and accurate device, topographic devices are continually evolving. AS-OCT devices are considered more accurate as they are less affected by scars and provide a corneal epithelial thickness map that is likely to play an important role in detecting early keratoconus cases; this topic is under further investigation (Kanellopoulos & Asimellis, 2014).